THE ONLY MULTI TIMEFRAME TRUE ICT
MARKET STRUCTURE INDICATOR IN THE MARKET
Ever feel lost figuring out which highs and lows really count?
Looking for a way to automatically spot those key Market Structure Shifts and Breaks?
It’s time to leave the guesswork behind.
Trade with a clarity that’s like having an X-ray vision for Market Structure.
THE Market Structure Indicator Features


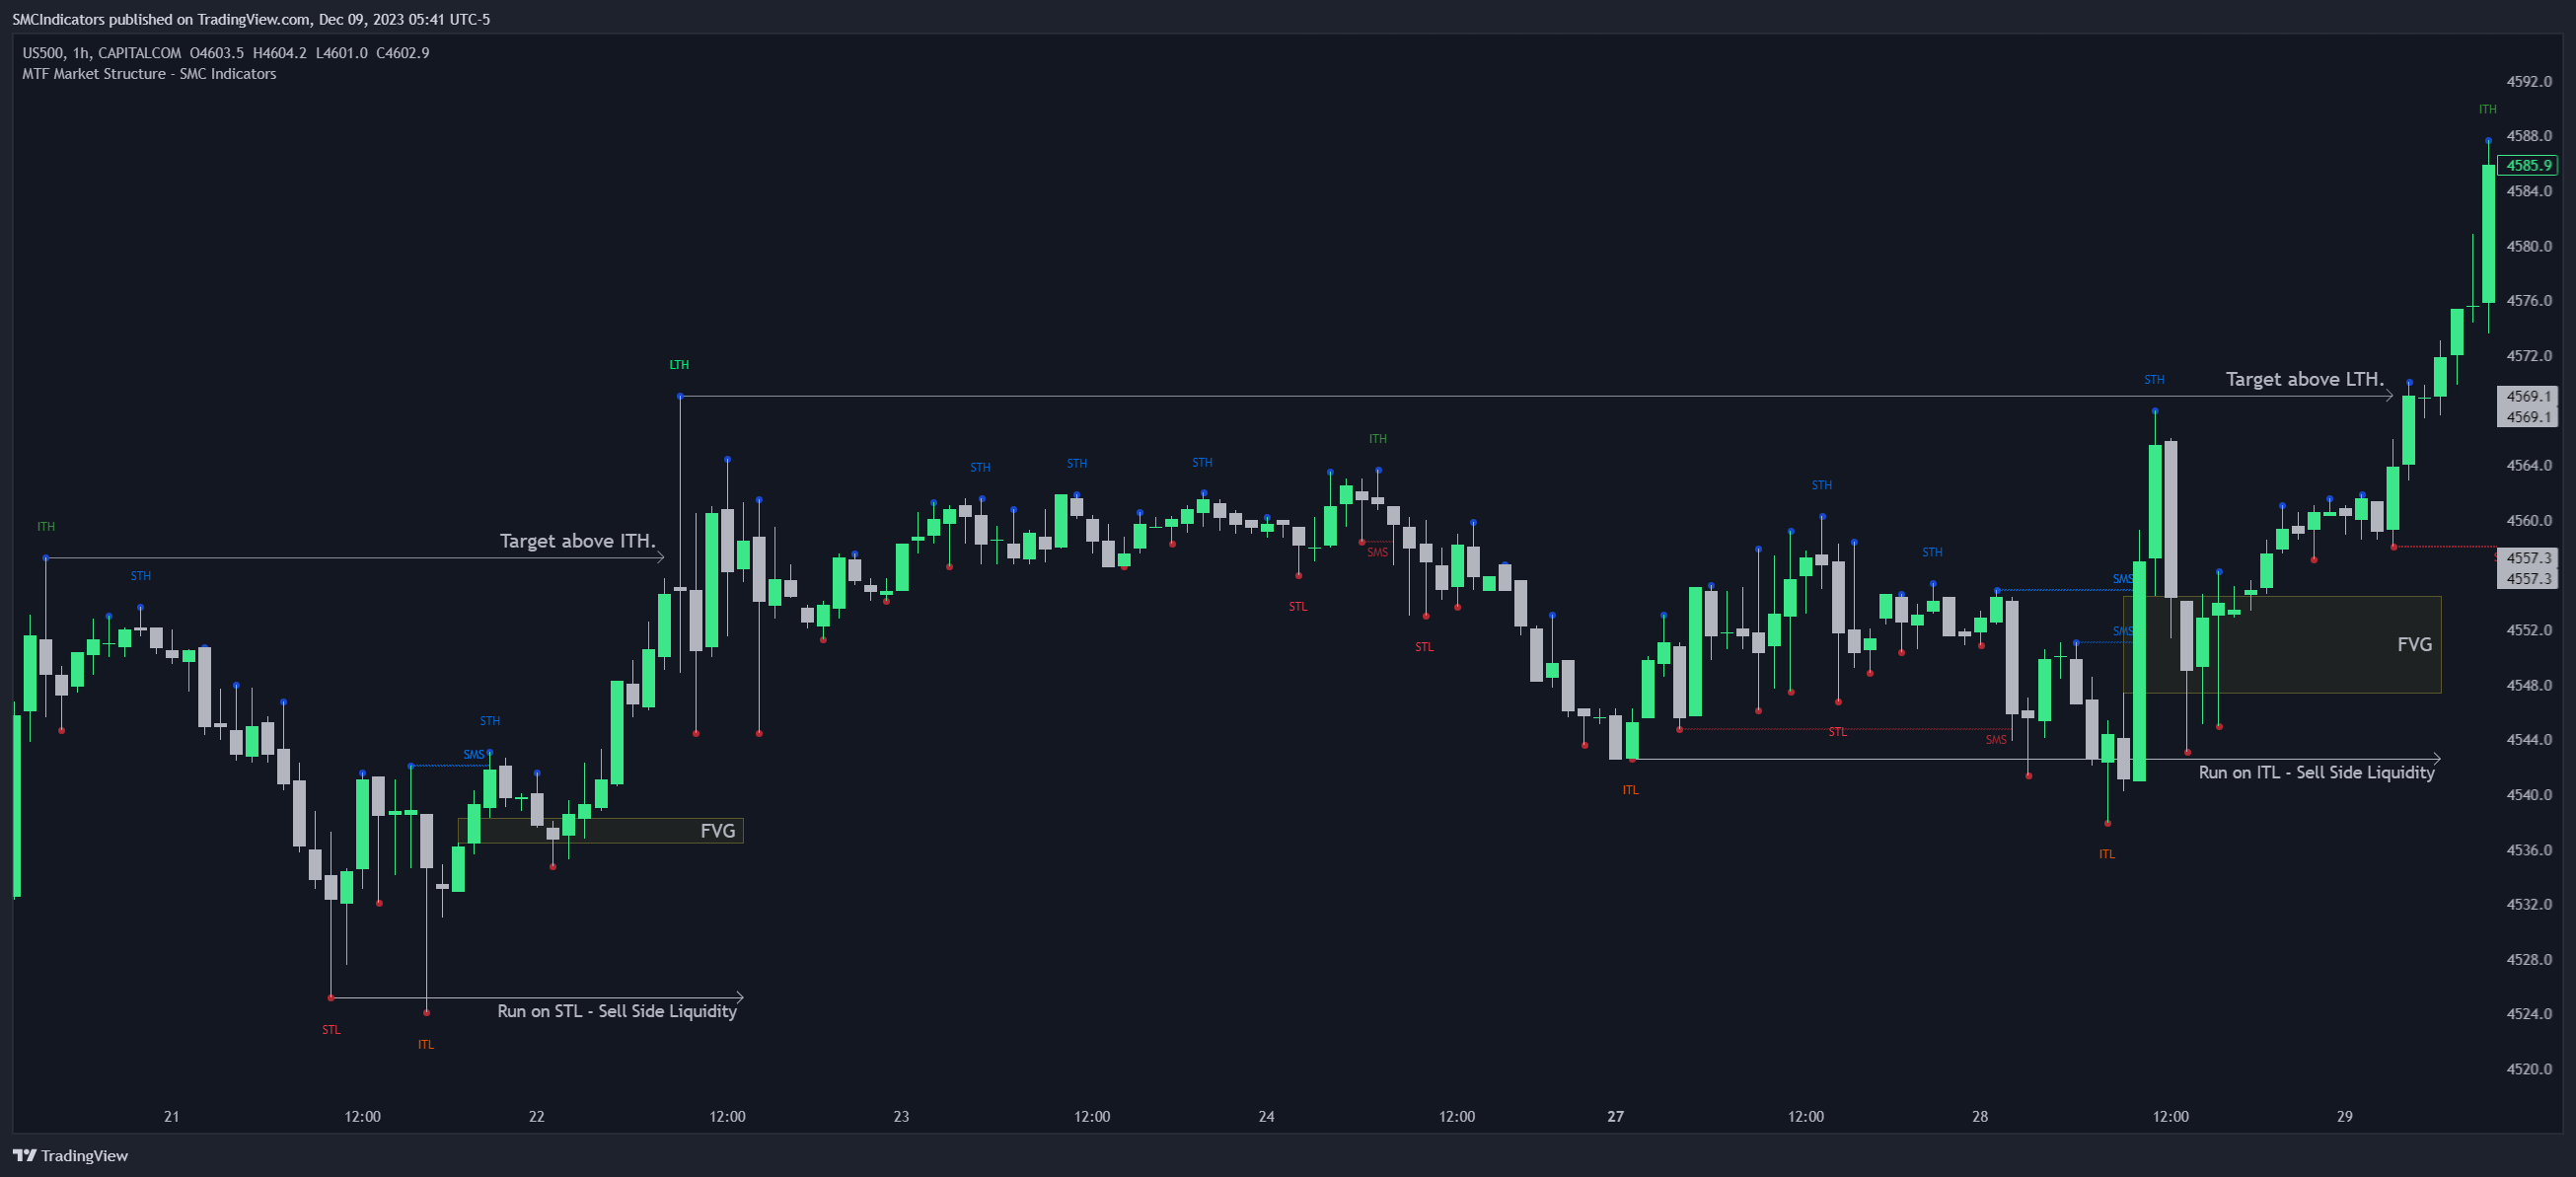
Identify key highs and lows
Unlock the power of precision in trading with our innovative indicator, expertly designed to identify “Key” highs and lows across multiple time frames. This allows traders to simultaneously maintain a multi-dimensional perspective of the Market Structure, enhancing decision-making and strategy development.
- Significant Swing High/Low.
- Short-Term High (STH) / Short-Term Low (STL).
- Intermediate-Term High (ITH) / Intermediate-Term Low (ITL).
- Long-Term High (LTH) / Long-Term Low (LTL).


Market Structure Shift/Break
Enhance your trading strategy with our state-of-the-art indicator that identifies Shift In Market Structure (SMS) and Break In Market Structure (BMS) for Entries.
The SMS is ingeniously designed to detect potential reversals in short-term market trends, while the BMS serves to identify longer-term trend reversals. This tool is not just an indicator; it’s your gateway to mastering Market Structure with precision like never before.
- Identify Market Structure Shift (SMS).
- Identify Market Structure Break (BMS).
- Understand when to use FVGs and when to use Inversion FVGs the right way.
- Use Market Structure to identify high precision entries after runs on liquidity.


MULTI TIMEFRAME ANALYSIS
Enhance your trading strategy with our versatile indicator, designed to integrate multi-timeframe perspectives seamlessly, aiding in top-down analysis.
This powerful tool not only recognizes key Highs and Lows within your current timeframe but also aligns them with both higher and lower timeframes, offering a comprehensive view of the current Market Structure.
It’s a flexible approach that applies to any trading style, be it swing trading, day trading, scalping, or short-term trading, acknowledging the fractal nature of price movements.
- Identify key highs/lows on current timeframe.
- Identify key highs/lows on one timeframe higher or more.
- Identify key highs/lows on one timeframe lower or more.
HIGH PROBABILITY ENTRIES TARGETS & entries
Elevate your trading strategy with our advanced indicator, which offers the capability to identify high-probability targets following a Shift in Market Structure (SMS) or a Break in Market Structure (BMS). This feature is particularly crucial for traders focusing on precise and strategic rule-based entry and exits.
- Set rule based targets above Key Highs or Lows after a Shift or Break in MS.
- Refine your trading: Perfect entry timing by entering post-liquidity purge.
- Identify key highs/lows on one timeframe lower or more.

Highlight market structure trend
Spot Trends with Ease: Our ‘Highlight Market Structure Trend’ feature serves as a powerful visual tool for backtesting, showcasing changes in market trends through colour-coded highlights.
Select ‘Shift/Break in Market Structure’ to see Bullish trends in blue following a Bullish Shift/Break and Bearish trends in red for a Bearish Shift/Break.
Take Your Trading to the Next Level
Using The Market Structure Indicator
In essence, this indicator isn’t just a tool; it’s a comprehensive solution for traders seeking to master market trends across multiple timeframes, enhancing their understanding of price action, entry, and exit precision.
All-Inclusive Membership Plans.
Free
Get Free Access to- Forex Kill Zones
- Index Kill Zones
- Access to Premium Community
Quarterly
Billed Every 3 Months- Access to All Indicators
- Access to Premium Community
- -
Yearly
Billed Yearly- Access to All Indicators
- Access to Premium Community
- -